Trade Smarter with Trade5Solver
Join 800+ traders using our backtested indicator today.
Supporting Traders with Data-Driven Insights for the Stock Market
At trade5solver, we provide high-accuracy a trading software backed by extensive testing. Join our community of over 5,000 traders and elevate your trading experience with our reliable indicators.
Our Mission
Why Choose Us
Our goal is to empower traders with educational tools and strategies that enhance decision-making across multiple assets. Learn to trade with confidence using our proven methods and resources.
Features
Build your trading knowledge using backtested tools and alerts designed for clarity and ease of use.
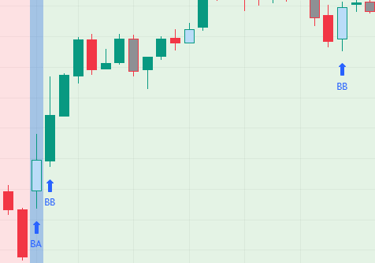
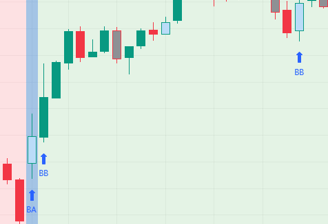
Accurately identify high-probability entry and exit zones based on market analysis.
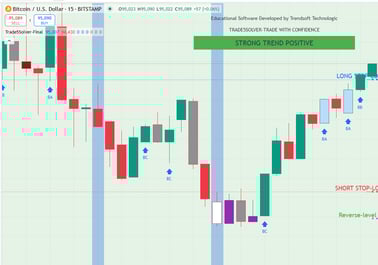
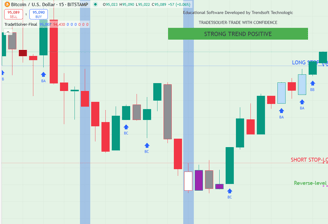
Precise trade entry and exit zones
Trade across various markets including stocks, crypto, and forex with our versatile indicators.
Dynamic Candle Color Indicators
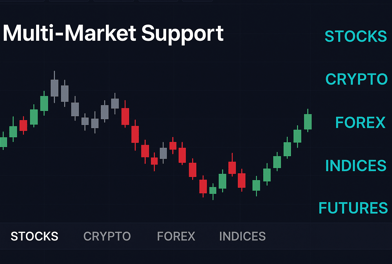
Multi-Market Support
Enhanced chart readability through color-coded candlestick patterns.
I started using Trade5Solver during my semester exams, and it made trading surprisingly simple. I could make quick, smart decisions without getting lost in complex charts, saving valuable time for my studies.
Akshad Kakad , A student from KJSC


★★★★★